


In a month, the number of posts on CBSV will have doubled. Each year, the 1-36(3,4,5) grows more ambitious, and this year is no different, with a month’s worth of posts planned, culminating in individual rankings for every team.
This year’s preseason preview for each team in Division I men’s college basketball brings not only a new format to CBSV, but also new proprietary statistics that will be referenced throughout the posts. This is a guide to those statistics, how they are used, and what can be learned from them.
Custom Metrics
Distribution Index

This value measures how often a player’s time with the ball leads to points, either through scoring or setting up teammates. Players at the high end tend to pass frequently without taking many shots, making it similar to usage rate but focused on passing, adjusted for shot attempts.
Four Factors Composite

By combining Dean Oliver’s Four Factors, we can see which teams excel in key areas of offensive production and possession management. While not as useful without knowing which specific metrics a team excels or struggles in, it offers valuable insight into fundamentals.
Turnover Gap

A straightforward statistic that reflects a team’s ability to manage turnovers on both ends while also highlighting assist production and point guard play. It is especially useful when paired with the distribution index.
Personal Foul Efficiency
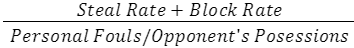
Measures how many possessions result in a forced turnover or successful aggressive play relative to the number of fouls a team commits. A high steal rate is less impressive if paired with a high foul rate compared to a team that forces turnovers more efficiently.
Normalized Statistics
Baseball fans are familiar with normalized statistics such as ERA+ or OPS+. These adjust a player’s performance for league averages, with 100 representing exactly average.
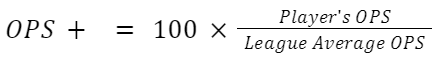
If a player has an OPS+ of 105, it means they are performing 5 percent better than the league average in on-base plus slugging. If the league’s average OPS is .700, this does not mean the player’s OPS is .705. The “plus” stat compares a player’s OPS to the league average as a ratio, rather than simply adding points to the average.
The value of “plus” statistics is their ability to show performance in context. In basketball, for example, a three-point percentage of 36.5 percent might seem strong, but without knowing how it compares to the rest of the country, it is incomplete. Plus statistics provide that context.
Many metrics have been adapted into plus statistics to better convey value. A useful example: a 3P%+ of 110 does not mean a player’s three-point percentage is exactly 10 percent better than the league average, but that it is 10 percent higher relative to the rest of the country.

Normalizing these statistics against the rest of the conference would be a useful addition in the future, especially given that the conference with the best three-point shooting efficiency (ASUN) is 3.5 percent ahead of the worst (C-USA). For now, this season’s plus statistics are compared only to the national average.
Consistency Values
Explored in a three-part series in June, game log data was analyzed for each team along with their performance across numerous statistics.
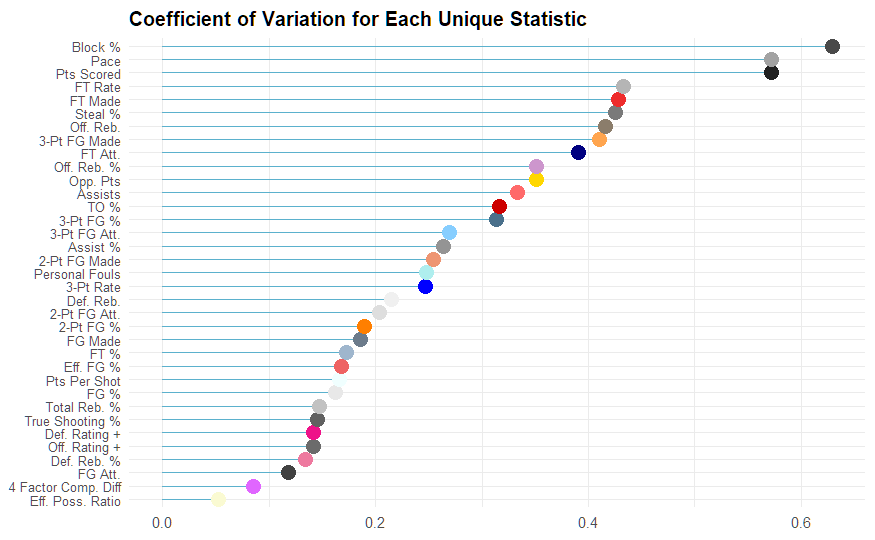
With these values, team-specific analyses can be drawn from understanding which statistics remained consistent on a game-to-game basis. While this was touched on in the third part of the series, it was largely anecdotal. A team-by-team look at consistency statistics is more fitting in the context of the 1-365. Consistency numbers, calculated by taking the coefficient of variation for each statistic between games and comparing them, provide specific insights into defense, shooting, and rebounding.
Meta Statistics
This marks the seventh time every team in Division I men’s college basketball has been ranked, giving us a solid sample to compare this season to previous ones.
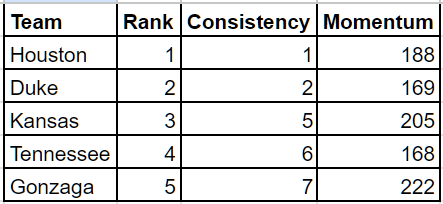
By examining three statistics: overall rank across six cycles, consistency, and momentum: we can identify which teams are trending upward and which have struggled recently. While this approach does not weight changes differently: treating a jump from 60 to 10 the same as 360 to 310, or preseason 2023 the same as postseason 2025—it still offers a quick way to analyze teams based on subjective but data-driven rankings.
Data Sources
As always, this project relies heavily on external resources, especially those freely available to the public.
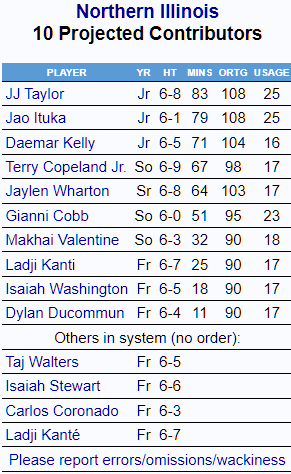
BartTorvik has projected rosters as early as June. While these projections may not be fully updated or reflect the latest information from team websites and Twitter scoops until later in the offseason, they provide a solid baseline for what to expect from each team.
HoopR allows for more engaging visuals at both the team and conference level. It provides full play-by-play statistics for each team, offering a more detailed look into the game.
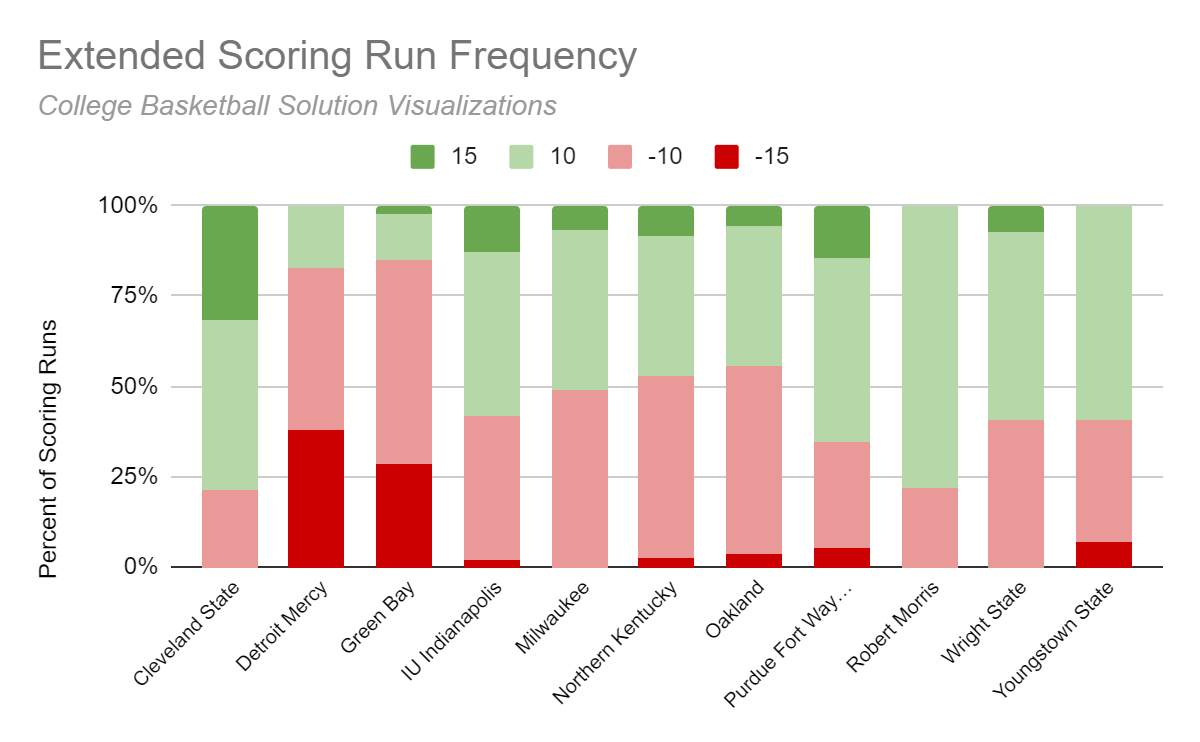
Finally, in developing statistics, I reference “extended scoring runs.” This concept was largely popularized by Evan Miyakawa. While the data itself is not proprietary, his work highlighted its value and brought broader recognition to its importance.
If you notice any objective errors in the posts over the next month, please let me know. The rosters reference data that isn’t always accurate, and team websites are rarely final in July and August. I would rather appear briefly uninformed to those who know more than spread misinformation to a wider audience.