


Exploring the SEC's 185-23 Non-Conference Slate
Some great bar trivia in years to come.

If You Can’t Do It Good, Do It Hard
As the season neared its midpoint, much was written about the SEC’s dominance against non-conference opponents and its potential to be one of the strongest leagues in college basketball history. However, early-season records often tell only part of the story when evaluating a conference’s true strength and its impact on tournament seeding. Notably, six SEC teams faced non-conference schedules that ranked in the 300s in KenPom’s strength of schedule metrics. While the conference’s 185-23 non-conference record appeared dominant on the surface, a staggering 133 of those wins came outside of Quadrants 1 and 2, potentially raising questions about the overall quality of competition faced.

The table above provides a clear answer to those questions. While two-thirds of the SEC’s non-conference games were expected to be, and largely were, non-competitive, we now have a clearer picture of how the league performed against top-tier competition. Across the conference, SEC teams posted a 32-18 record in Quadrant 1 games—averaging two Q1 wins per team with just over one expected loss. This is an incredibly impressive mark. For context, here’s how the other four major conferences fared in these crucial non-conference matchups.

Only the ACC, a conference with 18 teams, matched the SEC’s total Q1 game volume at 50. The Big Ten, another 18-team league, posted the best win percentage in Q1 opportunities at 36.59%. However, despite having two more teams than the SEC, Big Ten teams averaged just 0.83 Q1 wins and 1.44 Q1 losses—nearly 30% lower than the SEC’s remarkable 64% win rate. In short, the SEC not only scheduled more aggressively in non-conference play than any other high-major league but also delivered success at an unprecedented rate. It’s also important to note that the SEC is the only high-major conference that plays an 18-game conference schedule, while others play 20. This results in 36 more non-conference games across the league, offering greater opportunities to schedule high-level Q1 matchups. At the same time, it makes the SEC’s raw loss total all the more impressive.

With only five losses outside of Quadrant 1 across the entire conference, the SEC largely avoided the early-season letdowns that have plagued teams in years past. In fact, only one true buy game resulted in a loss—South Carolina’s season-opening defeat at home to North Florida. Surprisingly, this wasn’t the biggest deviation from expectations. That distinction belongs to Kentucky, whose 20-point loss to Ohio State in the CBS Sports Classic was the largest discrepancy between the KenPom projected margin and the actual result, a staggering 24-point swing.
Group Home
Another double-digit defeat came when Texas fell to UConn in early December. This was one of just two home losses suffered by an SEC team between mid-November 2024 and early January 2025. Of the conference’s 208 non-conference games, 135 (64.9%) were played at home, where SEC teams posted a dominant 133-2 record through the first two months of the season.
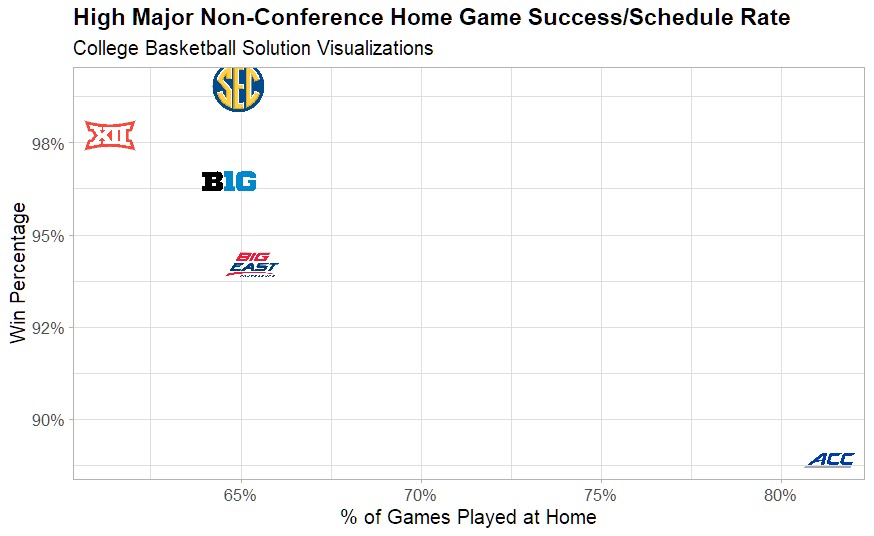
The chart above highlights that both the Big 12 and SEC dominated non-conference home games, boasting win percentages above 97%. Meanwhile, the ACC—by far the weakest high-major conference and closer to the Mountain West in KenPom’s Net Rating than to the next-worst high-major—played 15% more of its non-conference games at home than its peers. Despite this advantage, the ACC’s struggles stand out, especially considering that high-major teams typically win 90% of their non-conference home games. The elite leagues, the Big 12 and SEC, set the standard with staggering non-conference home win rates of 97.7% and 99%, respectively.
Flirting with Depth
Conference expansion in recent years has outpaced the ability of talent to keep up, creating a more diluted distribution of strength across leagues. Currently, 79 teams compete in high-major conferences—a number that has steadily grown.
The Big 12 has nearly doubled in size over the past two seasons, with half of its new members coming from the American Athletic Conference and the other half from the Pac-12. Now at 16 teams, the Big 12 matches the SEC in size, though the SEC’s recent additions—Oklahoma and Texas—were previously members of the Big 12. Meanwhile, the Big Ten has expanded exclusively with Pac-12 programs and now sits at 18 teams, equaling the ACC, which has swelled in recent years with additions that, for the most part, have not been major forces in college basketball.
This level of expansion has made it increasingly difficult for larger conferences to maintain the same level of overall quality. To quantify this, we can examine the five worst-performing teams in non-conference play from each power conference. This approach highlights how the bottom of each league either bolstered or dragged down its overall reputation. Of course, this method isn’t perfect—teams like Purdue and Alabama, for example, took losses due to ambitious scheduling rather than a lack of depth in the Big Ten or SEC.

From the visualization above, the five most losing high-major teams in each high conference accounted for a total of 98 non-conference losses. Once again, the SEC proved the most resilient, with its bottom five teams contributing just 11 losses—despite playing 10 more non-conference games than their counterparts in other leagues.
Best Dressed Demons
A useful complement to the Waffle Chart is the table below, which incorporates win percentage and accounts for the SEC's two additional non-conference games. In addition, the teams with the most losses in non-conference play had their Non-Conference Strength of Schedule Ratings averaged (per KenPom).

The most underperforming team among power conferences is Miami, with seven non-conference losses and a weak strength of schedule, ranking 276th in difficulty. On the other hand, the Big Ten stands out due to the tough nature of their schedule, with a strong win percentage despite many of their losses being attributed to challenging opponents. Ohio State, Michigan, and Purdue all posted three non-conference losses, but these are easier to overlook when considering the caliber of teams they faced.
For our analysis, teams like Mississippi, Kentucky, Missouri, Alabama, and South Carolina were considered. Many of these teams had solid records, with several posting 11-2 records. South Carolina, despite being off to the worst start in the SEC, only had three losses through 13 games. When compared to other teams in high major conferences with the worst non-conference records, only Rutgers—with four losses but three fewer wins—comes close.
Looking back with hindsight and considering roster strength and the quality of their opponents, South Carolina may be in the lower tier of the SEC, but other teams with two losses weren’t at the bottom of the standings. This ties into the larger theme of conference expansion—unlike teams added from the American or the now-defunct Pac-12, the SEC benefited from adding established power conference teams.
The SEC’s non-conference performance is even more impressive when considering the improved quadrant structure, the clarity of the league's tiers when teams match up, and the underperformance of other conferences, even in games outside of the first two quadrants. With a combination of significant win totals—no SEC team had fewer than 10 wins by New Year’s Day—a remarkable win percentage in the first two quadrants, and the context of the league's size, it’s clear that the SEC is one of the best conferences we’ve ever seen.
-BM